
Released · v1.0.0
Explain It Visually
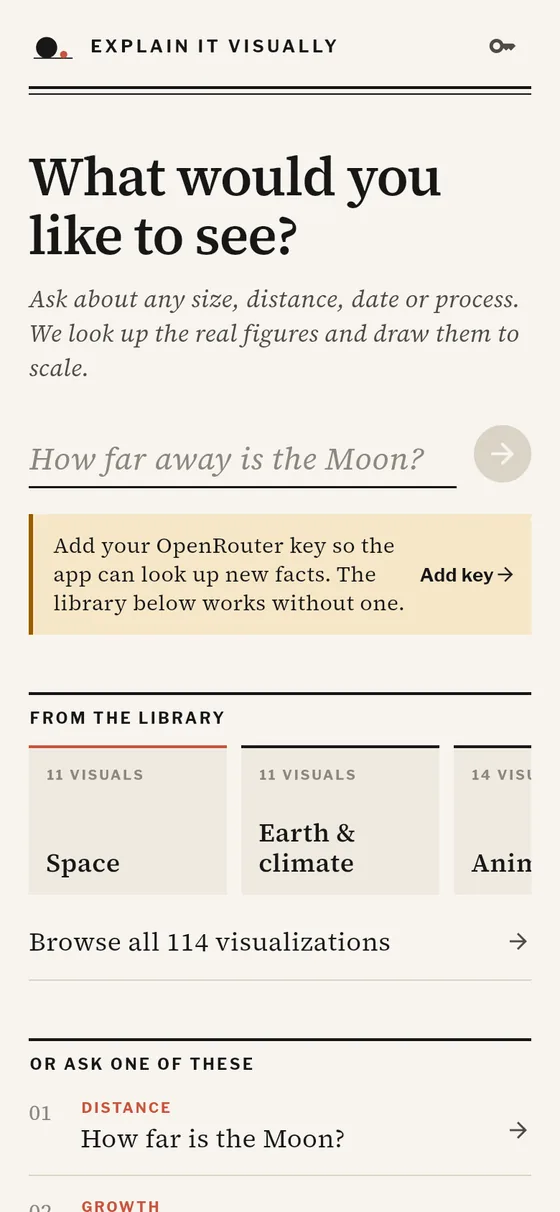
Type any concept and get an animated, to-scale visualization with real facts.
Ask "how far is the Moon" or "blue whale vs a bus" and get an animated chart built from real facts. The AI never draws or writes UI code: it returns facts and picks one of 20 chart templates, and hand-built D3 templates do the drawing.
- Platforms
- Android
- Version
- 1.0.0
- Built with
- Flutter, Riverpod, Dart shelf server, D3 in a WebView, OpenRouter / Gemini
Try it
Its charts are drawn in a native WebView, which a browser demo can't host. Install the Android app to try it.
What it does
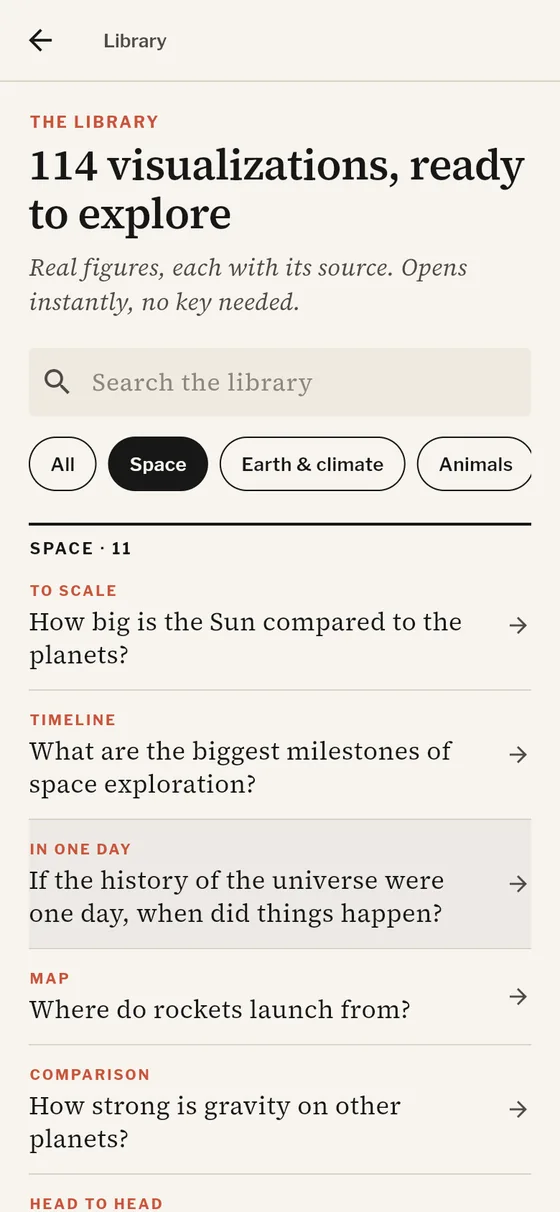
- Any question becomes an animated, to-scale visualization
- 20 chart templates: scale zoom, timeline, exponential growth, pictogram, versus and more
- Every number comes with a source note, and low-confidence facts get a warning badge
How it’s built
- Two LLM layers, facts then planning, both validated by a shared pure-Dart package with one retry
- The planner can only refer to facts by id, so it can't invent numbers
- A small Dart server holds the LLM key; the app never sees it
Explain It Visually privacy policy